Impacts on Global Forests

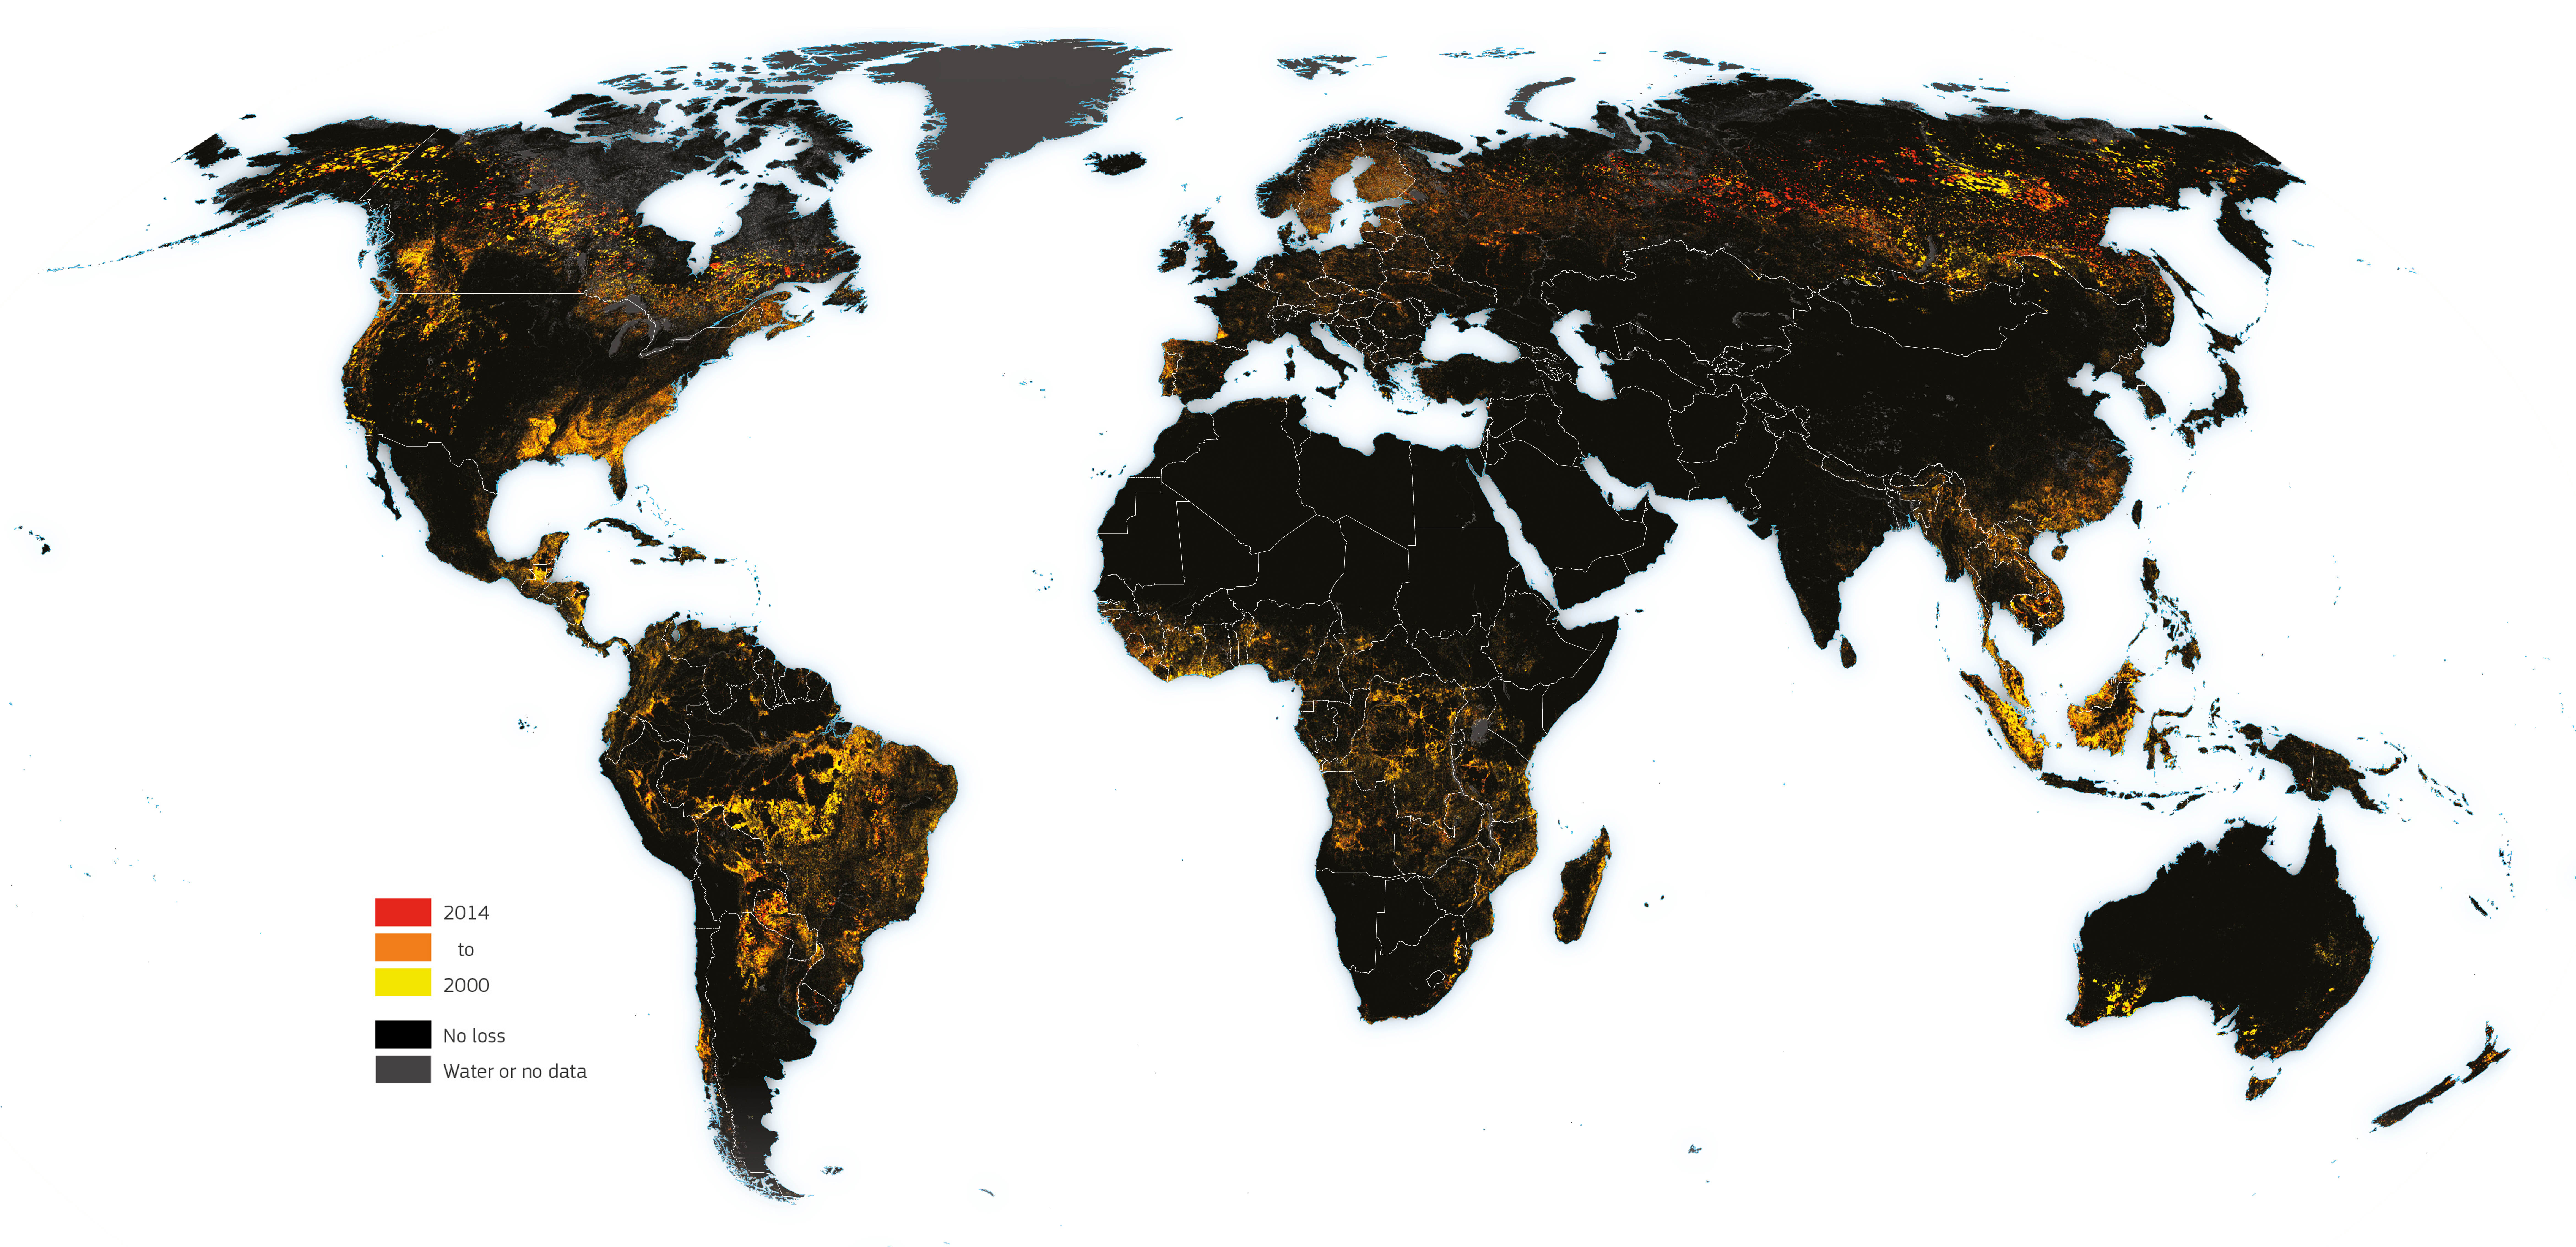
Map of tree cover loss
This global map is based on time-series analysis of Landsat images characterising extent and change of tree cover. ‘Tree Cover Loss’ is defined as percentage loss during the period 2000–2014, as far as detectable for the individual pixels of the satellite imagery and including tree cover outside of forests.
The map shows the loss per year in different colour.
Source: Hansen et al., 2013.
Forest change can contribute to land degradation
The 2015 Global Forest Resources Assessment of the Food and Agriculture Organization1 reported that the total area of global forests has declined by 3 % over the previous 25 years. However, there has been some glimmer of hope. Between 1990 and 2000, the annual rate of net global forest loss was 7.3 Mha per year but was halved to 3.3 Mha per year between 2010 and 2015. These figures are encouraging but must be examined in the context of natural versus plantation forests and by the rapidly changing rates of deforestation and afforestation. For example, the global area of natural forest area decreased by 6 % between 1990 and 2015. The replacement of natural tropical forest with intensively managed plantations of exotic tree species will undoubtedly increase overall timber production potential but will reduce its natural biodiversity, habitat value and supply of ecosystem services.
The dynamics of national- to global-scale economic opportunities, combined with public policies, drive forest change. In addition to the economic consumption of forest products (i.e. timber, fuelwood), there is also the demand for land for agricultural expansion and the construction of roads and other infrastructure, all of which lead to deforestation, land degradation, biodiversity loss and habitat fragmentation. For example, the recent surge in deforestation in the Brazilian Amazon is due to economic instability, monetary exchange rates, political support for agribusiness and reduced government expenditure on the enforcement of existing environmental laws. The differential importance of these sets of drivers lead to regionally distinct patterns of forest decline.
Forests are the most biologically diverse ecosystems and critical for sustaining local and global livelihoods. They produce oxygen, equilibrate freshwater flows and cycle nutrients in addition to providing important provisioning services. Over 25 % of all global forests are managed specifically for soil and water protection6. Reforestation and forest regeneration can be a major global carbon sink, but the current rate of forest degradation and subsequent release of greenhouse gases is contributing to climate change. Carbon stocks in forests have decreased by almost 11 gigatonnes (Gt) in the past 25 years1. Although CO2 emissions from net forest conversion decreased from an average 4 Gt CO2 yr-1 (2001-2010) to 2.9 Gt CO2 yr-1 (2011-2015), suggesting a smaller than expected contribution to anthropogenic forcing due to forest loss, the emissions from forest degradation increased significantly from 0.4 Gt CO2 yr-1 in the 1990s to 1.0 Gt CO2 yr-1 during the period 2011-2015.
Deforestation can be considered a type of land degradation when forest ecosystems, with all of their important cultural, regulating and provisioning services, are exchanged for another land use, such as crop agriculture, with a narrow provisioning service focus. Some of the damages sustained by the land resource are the immediate reduction or loss of biomass productivity with a linked loss in habitat, biodiversity, and carbon stock. Clearance of natural forests accelerates soil erosion and the alteration of soil functioning. This can provoke a reduction in carbon, nutrient and water storage and cycling capacities that seriously affect land productivity or the long-term productive capacity of the land system. These effects can be partly offset when previously forested land is managed under adaptive and sustainable practices.
In many cases, introduced agriculture, including pasture and crops, does not focus enough on protecting the newly exposed land area, and the trade-off of forest for alternative land uses leaves a permanent deficit in ecosystem services. Resilience of forests is highly variable, but due to the feedback process of land degradation, disturbance may lead to a downward spiral in the ability of the land to provide the ecosystem goods and services that characterised the original state. Participatory forest planning and management is one approach that can lead to the development and dissemination of adaptive practices that increase the quality of natural capital factors through reduction in loss of biodiversity, reduced forest fragmentation and reduced vulnerability to soil erosion and landslides.

Forest Area Change in the Amazônia Legal region of Brazil (Mha/year).
Source INPE.

Tree canopy cover >=10 % (Mha) in Drylands New estimates of dryland forest cover reveal a larger than expected area covered with trees, adding around 9 % to the global total forest cover. An estimated 1327 Mha of dryland area with tree canopy cover of more than 10 % - a surface similar to the area of tropical moist forest cover - underline the importance of dryland forest in general and its potential role in the global carbon cycle.
Source: J.F. Bastin et al., 201717.

Forest Area Change in Asia. While for all of Asia an increase in total forest area is reported for the period 1990 - 2015, mainly due to forest plantations in China, there is still substantial forest loss in tropical areas.
Source: FAO FRA, 2015.

Global Forest Area estmates (Mha) and Annual Loss of Forest (Mha).
Source: R.J. Keenan et al. 2015.

At regional scale, North and Central America, Europe and Asia report increases forest carbon stock while South America and Africa report strong decreases and Oceania reports stable forest carbon stocks. The annual rate of decrease of forest carbon stock weakened between 1990 and 2015.
Source: H. Eva.
|
Globalisation
|
Environmental Globalisation |
|---|---|
| Virtual Water | |
| Anthromes |
